Aside from my research, the following is a taste of some of my interests inside and outside school.
Motion magnification in Python #
October 2025
GitHub: NathanGillispie/riesz-pyramid-motion-magMotion magnification has been on my mind since the classic Eulerian Video Magnification video first popped in my YouTube feed circa 2020. This topic has gained a lot of attention recently due to Steve Mould’s videos, so I thought I would finally share what I have done.
I’m mostly referencing Riesz Pyramids for Fast Phase-Based Video Magnification and its supplemental material for my rewrite of the code. I was able to get the Eulerian Video Magnification code working in Winter 2023 on MATLAB R2011b on Windows 11, and it was only 2025 when I finally decided to rewrite the code so you don’t need a MATLAB license :)
As useful as it is to amplify motion, many technical challenges prevent me from doing it properly. For example, I ideally need a high frame-rate camera with no rolling shutter, and a computer capable of capturing the uncompressed raw video and processing it. I find it more interesting to isolate the amplification. You end up with very cool visuals.

Audio plugins (VST3) #
December 2022 — now
Digital signal processing is cool and I like make programs to do it for me sometimes. Nothing bad will happen if you load these in your DAW.
GitHub: NathanGillispie/KiosPluginsPolySlew: Polynomial slew limiter #
PolySlew is a new take on the slew limiter. If you look at a given sample under a taylor expansion (it’s a discrete signal but assume it isn’t), the constant term is clamped to a range of values with a traditional limiter. The slew limiter clamps the linear term, or the first derivative of the signal. PolySlew generalizes this to the cubic term and adds different algorithms. This plugin was made to be as transparent as possible. It will blow up your speakers. Please add a limiter and high-pass after it.
Read the full blog post here.Dynamic phase shifting to minimize peak-to-RMS ratio #
I’ve been researching a way to make a similar plugin to one in iZotope RX 10. There’s a function that minimizes peak signal by locally altering the phase of the frequencies. I’ve sunk so much time into figuring this out, and I really want to make it work. This has caused me a lot of frustration, but I do think it will pay off.
The amazing thing about the original plugin is that it results in practically no transient smearing, symptomatic of many IIR filters. Somehow, it determines how to shift the phase of (presumably) lower frequencies to reduce asymmetries in waveforms, but this happens to reduce the peak amplitude, increasing your headroom.
Spectral dynamics (Soothe2 clone) #
I’m also in the research phase for a plugin that is essentially a compressor for different frequencies. Soothe2 popularized the technique, but MeldaProduction now has a similar one called MSpectralDynamics.
Generative Adversarial Network trained on my face #
December 2021
Made quite a few updates to FastGAN-pytorch to train NathanGAN entirely from scratch, using only photos of myself. I also started training a model on tornados locally, but that was too slow for my little laptop. I was still shaken from the 2021 Bowling Green tornado. Results are eerie.
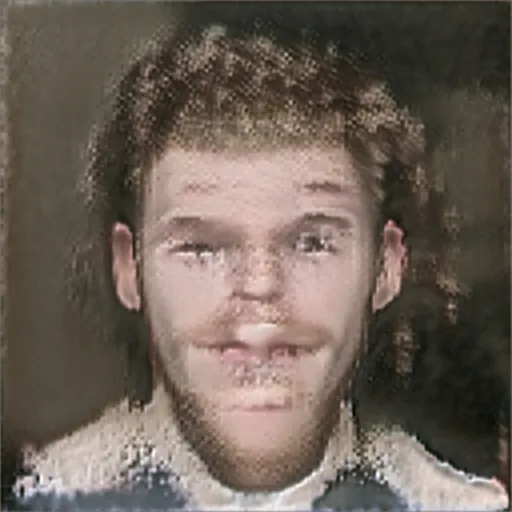


I also used the pre-trained model for the FFHQ dataset for a video.
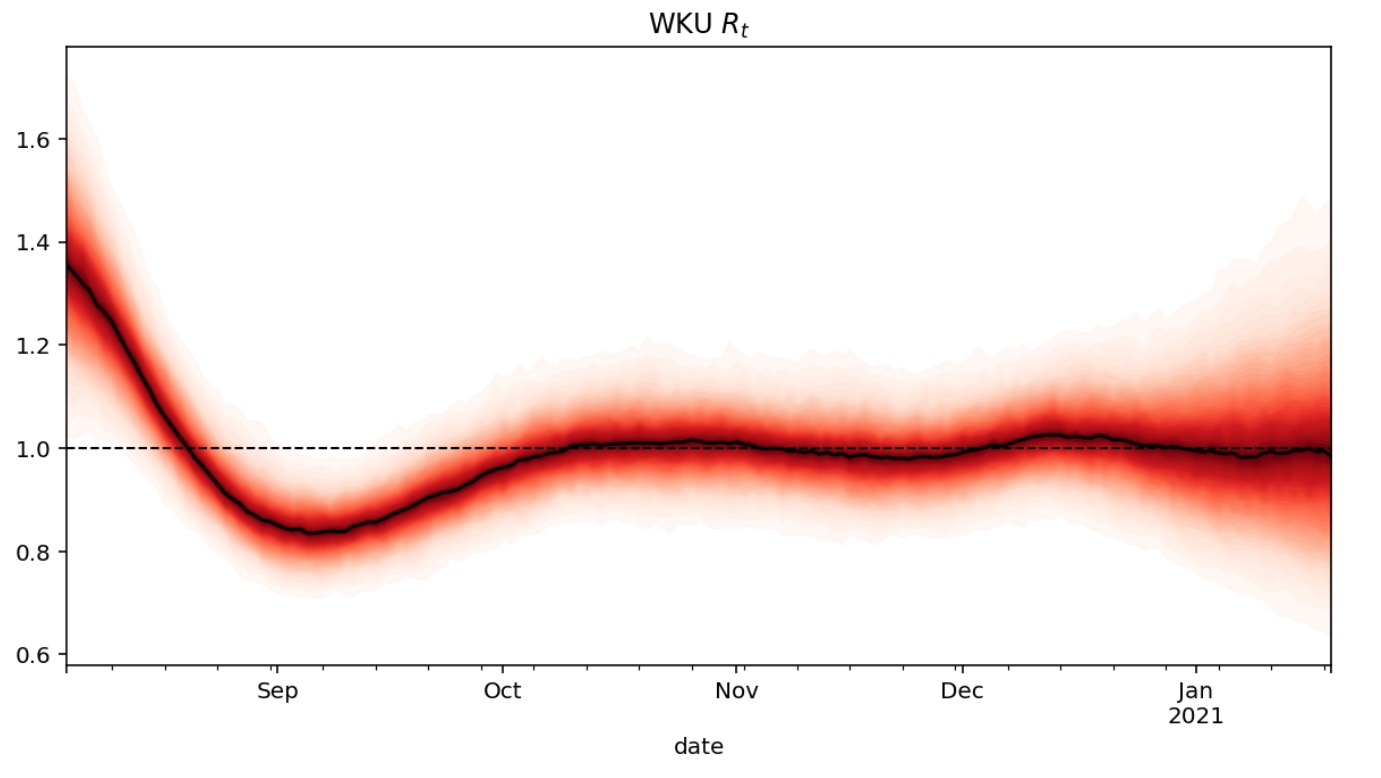
Effective Reproduction Value (Rt) of COVID-19 in the WKU Community #
January 2021
Rt is a key measure of how fast a virus is growing. It’s the average number of people who become infected from an infectious person. If Rt is above 1.0, the virus will spread quickly. When Rt is below 1.0, the virus will stop spreading. These values were calculated on January 12, 2021 using data provided by WKU’s Engineering & Applied Sciences Department. The number of reported positive case “counts include anyone who self-identifies as a member of the WKU community to contact tracers or the WKU COVID Response Team regardless of whether the individual lives on campus or has physically been on WKU’s campus.” —WKU COVID Dashboard
This project took the home page of my personal website when WKU was still reporting positive cases.
The model used to calcuate Rt is the exact same model used in https://rt.live. All credits go to Kevin Systrom and Thomas Vladeck for their contributions. A GitHub repository for the code used in this model can be found here.
I am neither an expert in epidemiology nor statistics. I have not consulted experts in these fields. I am just a student interested in applying this model to my own campus. The following are known issues:
- The model needs what is basically the positivity rate which changes over time as the group of people tested changes. The model may underestimate current values of Rt because far more people without symptoms are tested, thus driving the positive percentage down and overstating a downward trend in cases.
- The model relies on a distribution for the delay between infection and a reported positive test. Most of the data used to generate this distribution is from Germany early in the pandemic — it is possible this delay distribution looks different in the US and across variants.
Everyone has the right to freely accessible scientific knowledge, especially regarding the spread of COVID-19 in their community. My page was created to inform campus administration and those interested.
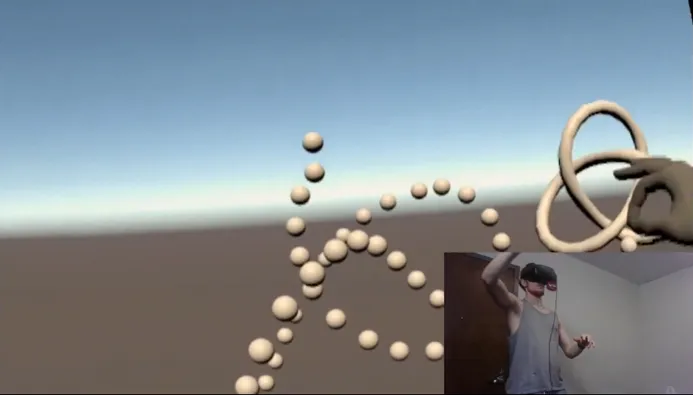
Oculus Knot Visualizer #
Fall 2019
What a fun program. Built to visualize knots, especially as they relax.
GitHub: NathanGillispie/oculus_knot_visualizer